Couple of years ago InfoQ wrote about a Java/Eclipse developers tool called Code Bubbles. The idea was simply the current nature of the software development IDEs is really file-based (at least most of it or the most used of it ). and there are no convenient way to create and maintain a simultaneous view of different fragments of the code-base not based on the logical sequencing instead of the file storing the code.
Each bubble is a fully editable and interactive piece of code ( you can think of it as a tiny IDE in a bubble) it can contain a method or group of methods The bubbles exist on a 2-D canvas that represent the current working space.
A collaboration between Brown University (Where Code Bubbles was born) and Microsoft Research, integrating ideas from Brown University’s Code Bubbles project into Visual Studio result Debugger Canvas as a new power tool for Visual Studio that enable Code Bubbles Like experience, it enable visual debugging experience based on code bubbles on a 2-D canvas which in return I believe it will greatly increase developer productivity and understanding of the code set.
At the current time of writing Debugger Canvas v1.1 is released to work with Visual Studio 2010 SP1 Ultimate only and the reason according to Microsoft, Debugger Canvas is built on top of Visual Studio Ultimate so that it can re-use the underlying technology for the Dependency Diagrams to identify and display the right fragments on the canvas.
Debugger Canvas offers a great set of features as listed in the website:
- Switch between Debugger Canvas and file based debugging with a single click, even in the middle of a debug session
- Debug multiple threads side by side with each thread and its most recent stack frame easily identified
- Get an overview over recursive calls by showing one bubble per invocation
- Navigate easily up and down the call stack in the canvas itself
- Step into methods on a canvas using the debugger
- Use the normal debugger features in the canvas
- Share a canvas as an XPS image
- Take snapshots of local variables so you can make comparisons as you step through code multiple times
- Add related methods to the canvas using Go to Definition and Find All References
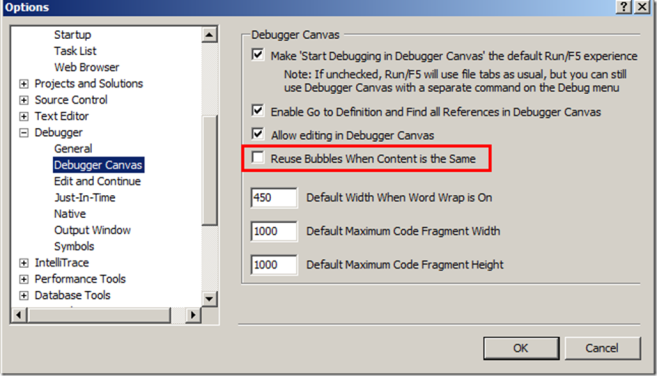
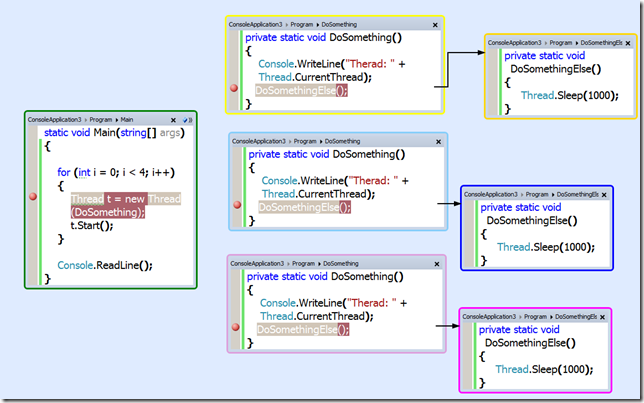
My best feature is the ability to debug multiple threads, the default behavior though is to show only one bubble per canvas for all threads sharing that code, So if you want to be able to see different threads have different executing bubbles even for shared code. The you’ll have to go to Debugger Options in Visual Studio Options Dialog, you’ll see a new node for Debugger Canvas. Disable the Option “Reuse Bubble when the content is the same”.
Now you can see the same code bubble highlighted with different color indicating a different thread call to the same function.
I’ve been using Debugger Canvas for couple of months now and I find it really fun, amazingly in some situations a little disturbing, especially when the visual canvas gets very cluttered with bubbles and require a lot of scrolling and zooming-in but you can always switch back to the file based view. Nevertheless it’s a great tool I highly recommend especially in sophisticated multithreading algorithms debugging scenarios it helps a lot to understand what is happening, give it a shot.
More Information:
- InfoQ: Debugger Canvas Brings Code Bubbles To Visual Studio
- Code Bubbles Home Page.
- Debugger Canvas Home Page
- Download Debugger Canvas
Hope this helps,
Ahmed


